Support and resistance are two of the most powerful technical indicators on the market.
Without watching either, you may just buy or sell at the wrong time.
Support, for example, represents the moment when buying begins to overwhelm selling and prices begin to bounce back. Resistance happens when selling begins to overwhelm buying and prices begin to pivot lower.
When it comes to spotting support, look for a series of low points when a stock continues to fall to a certain level, but then doesn’t fall any more. When it comes to resistance, look for a series of high points when a stock continues to fail at a specific ceiling price.
The more times a stock bounce off support and resistance, the stronger these support and resistance lines become for technical analysis. After all, if something repeats itself again and again, it becomes a stronger indicator of potential pivots at high or low points on a chart.
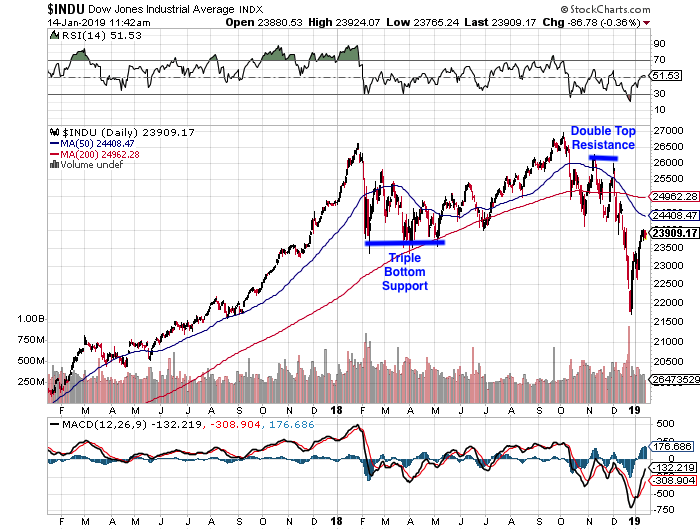
For example, look at the Dow Jones Industrial Average (DJIA).
Between February 2018 and May 2018, the index fell to the same point three times and bounced each time. This is what’s also known as triple bottom support.

In fact, we can see that the index again found support in the same place in July 2018, and again in October and December 2018.
The more times the DJIA bounced from that region, the stronger the support line became.
Or, we can look at what happened between November and December 2018. You’ll notice resistance at 26,000. Each time the DJIA tested this “line in the sand,” it failed and pushed lower. This is what is commonly referred to as double top resistance.
Of course, we never want to rely on just tops and bottoms.
Granted, not every trader or investor is a fan of technical analysis. But it should never be ignored, especially when it can clearly spot buy and sell points accurately.
Even if you just rely on fundamental analysis, consider playing around with technicals, too.

